
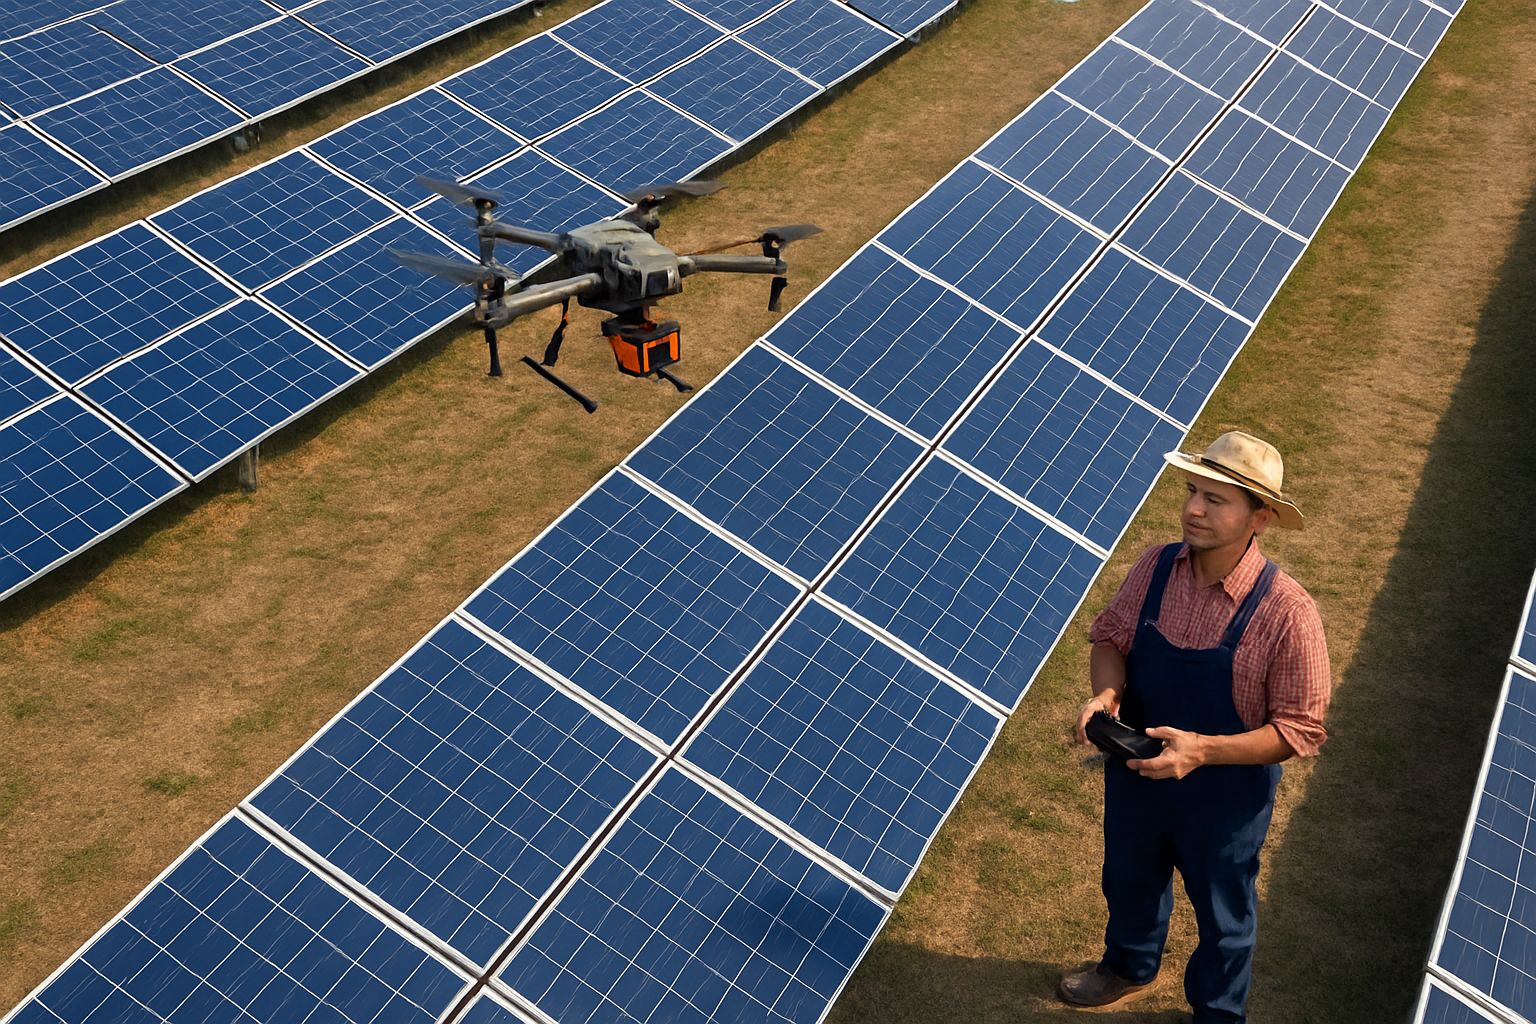
Key Takeaways: Drone Solar Panel Inspection
- Drones cover 50–100 MW of solar panels per day — a task that would take ground crews weeks to complete manually.
- Thermal drone sensors detect temperature differences as small as 1–2°C, flagging faults long before they cause measurable energy loss.
- Early fault detection through drone inspection can recover 2–5% of annual energy output that would otherwise be silently lost.
- Inspection costs run $150–$500 per MW — a fraction of the revenue a single undetected string failure can drain over a season.
- Keep reading to find out exactly which faults drones catch, which sensor does what, and whether the math actually works for your operation.
Most solar panel failures don’t announce themselves — they bleed yield quietly, day after day, until someone finally looks.
For farmers who’ve invested in on-farm solar to offset energy costs or generate income, that silent bleed is a real financial problem. A string disconnection, a cluster of hotspots, or a bypass diode failure won’t trip an obvious alarm. What it does is quietly reduce what your system produces, often for months before anyone notices. Drone inspection solar panels technology was built specifically to find these problems fast, at scale, without putting anyone on a ladder or a roof.
Birds Eye Aerial Drones works with solar asset operators to run exactly these kinds of inspections — combining thermal and RGB imaging into a single flight pass that produces actionable data, not just pretty pictures. If your farm runs solar and you haven’t had a formal drone inspection, this article is going to reframe how you think about maintenance.
Drones Catch What Farmers Miss in Solar Panel Inspections
For years, checking the health of a solar array meant walking rows with a handheld thermal camera, squinting at a screen, and recording findings on a spreadsheet that was outdated by the time you finished. It was slow, physically demanding, and realistically only covered a fraction of any large installation. Smaller issues were almost always missed.
Drone inspection flips that entirely. A single drone flight can cover ground-level thermal inspection work in hours rather than days, capturing every panel from a consistent altitude and angle, with radiometric data attached to every frame. The difference in coverage isn’t marginal — it’s measured in orders of magnitude.
How Thermal Cameras Detect Panel Faults Invisible to the Eye
Thermal cameras on inspection drones don’t just show heat — they measure it with precision. Radiometric infrared sensors record the actual temperature of each panel surface, not just a color gradient. When a cell is failing, shaded, cracked, or disconnected, it either generates excess heat or produces significantly less than its neighbors. A properly calibrated drone thermal system detects those differences at 1–2°C sensitivity, which is enough to catch faults at their earliest stage, well before they cascade into larger system failures or visible damage. For farmers interested in solar technology, understanding the best solar panels for farmers can be crucial in maximizing efficiency and minimizing issues.
Drone Coverage: 50–100 MW Per Day vs. Weeks on Foot
The coverage math is stark. A ground crew with handheld equipment might thoroughly inspect 1–2 MW per day under good conditions. A drone with an automated flight path and dual-sensor payload covers 50–100 MW in a single day. For a mid-size agrivoltaic operation running 5–20 MW, that means a complete inspection in hours — not a week-long mobilization that disrupts other farm operations.
Early Fault Detection Recovers 2–5% of Annual Energy Losses
That 2–5% recovery figure deserves context. On a 10 MW system producing power at average agricultural rates, a 5% yield loss represents a meaningful revenue gap every single year. Catching the faults causing that loss — and catching them early enough to repair before the next billing cycle — is the entire economic case for regular drone inspection.
- Hotspot clusters from cracked cells can reduce string output by 10–30%
- A single failed bypass diode takes out one-third of a panel’s production capacity
- Soiling on panels in dry climates can cause 5–25% efficiency drops without any physical damage
- Vegetation encroachment, if left unchecked, can shadow entire row sections seasonally
These aren’t worst-case scenarios — they’re routine findings on farms that haven’t had a structured inspection program. The point of drone inspection isn’t to find catastrophic failures. It’s to find the quiet ones before they become expensive.
The Real Cost of Skipping Regular Solar Panel Inspections
Skipping inspections isn’t a neutral decision — it’s an active choice to absorb losses you could have avoided. The cost of a drone inspection is fixed and predictable. The cost of an undetected fault is cumulative and invisible until it suddenly isn’t.
How Undetected Faults Silently Drain Farm Revenue
Solar monitoring systems give operators a high-level view of total system output, but they rarely identify which specific panels or strings are underperforming. A system showing 94% of expected output might look acceptable on a dashboard — until a drone inspection reveals three failed strings, a soiling problem across one full row, and two panels with active hotspots. Each of those issues was hidden inside an average. The monitoring system confirmed the farm was producing. The drone inspection revealed what was being lost.
A 5% Yield Loss on a 10 MW Site Costs $40,000 Per Year
Run the numbers at an average commercial solar rate and a 5% yield loss on a 10 MW installation translates to roughly $40,000 in lost annual revenue. A full drone inspection of that same site — thermal imaging, RGB visual survey, georeferenced report, and fault prioritization — costs between $1,500 and $5,000. The inspection pays for itself the moment it identifies faults causing more than a fraction of that loss. For most sites, that threshold is met in the first flight. Learn more about the benefits of PERC solar panels for agriculture.
What Drones Actually Check on Solar Panels
Understanding what drone inspection actually detects — and how each fault type shows up in the data — helps farmers ask better questions when commissioning an inspection and act faster when the report arrives. For those interested in the types of solar panels being inspected, check out this comparison of bifacial vs. thin-film solar panels.
Hotspots and Thermal Irregularities
Hotspots are the most common finding in any drone thermal inspection. They appear as localized areas of elevated temperature on individual cells or panels, caused by partial shading, cell cracks, manufacturing defects, or internal connection failures. On a thermal image, a healthy panel shows an even temperature profile. A panel with a hotspot shows a bright, concentrated heat signature on one cell or bypass zone — unmistakable once you know what you’re looking at.
Left unaddressed, hotspots accelerate panel degradation and, in severe cases, create fire risk. Catching them early means a repair or replacement call, not an insurance claim.
Cracked Cells and Physical Damage
Cell cracks are often invisible to RGB cameras but produce a clear thermal signature during flight. Micro-cracks from hail, mechanical stress during installation, or thermal cycling show up as irregular temperature patterns across a cell. More severe physical damage — from hail impacts, wind debris, or animal activity common on farm sites — shows clearly in high-resolution visual imagery captured simultaneously with the thermal pass.
Dual-sensor drone payloads, like those used on the DJI Matrice 350 RTK, capture both datasets in one pass, which means every cracked cell flagged thermally can be cross-referenced with its visual image immediately without a second flight.
Soiling and Debris Accumulation
Dust, bird droppings, leaf litter, and agricultural residue accumulate on panel surfaces over time. RGB imaging from drone inspection provides a high-resolution map of exactly where soiling is concentrated — which rows, which end of the array, which panels near treelines or irrigation equipment. That data turns reactive cleaning into a targeted operation rather than a full-site wash every season.
Bypass Diode Failures and String Disconnections
Bypass diodes protect panels from hotspot damage by rerouting current around shaded or failing cells. When a bypass diode itself fails, it takes roughly one-third of that panel’s production capacity offline — permanently, until replaced. String disconnections are similarly invisible to standard monitoring until the output gap becomes large enough to register as an anomaly. Thermal drone inspection catches both: failed bypass diodes show a distinctive one-third panel heat signature, while disconnected strings appear as uniformly cool rows against an otherwise active array.
Vegetation Encroachment Around Panel Arrays
Field Finding: On agrivoltaic installations where crops or pasture grass grow beneath and around panel rows, seasonal vegetation growth is one of the most consistently underestimated yield threats. A row of panels shaded by two feet of overgrown grass along its base can lose 10–20% of its output during peak growing months — a loss that looks like normal seasonal variation on a monitoring dashboard but shows up immediately on a drone RGB survey as a clear encroachment pattern along the panel row base.
Drone RGB imaging captures vegetation encroachment at a resolution fine enough to distinguish grass overgrowth from intentional ground cover plantings, which matters on farms running integrated agrivoltaic systems where understory management is deliberate. The inspection report maps exactly which rows are affected and by how much, giving grounds crews a prioritized mowing or herbicide schedule rather than a full-site walkdown. For more on optimizing solar panel efficiency in agricultural settings, explore our comparison of solar panels for farmers.
For farmers running sheep or cattle under panel arrays as part of a grazing management strategy, drone inspection also flags areas where animals may have damaged panel frames, wiring conduits, or mounting hardware — damage that’s nearly impossible to spot from outside the array rows without walking every meter of fencing and structure.
Combining thermal and RGB data in a single inspection pass means vegetation and structural findings arrive in the same report as electrical fault data, giving farm operators a complete picture of array health rather than separate reports from separate site visits.

“Drone Inspection Technology …” from garudsurvey.com and used with no modifications.
How Drone Solar Panel Inspection Technology Works
The inspection technology behind a drone solar survey is more sophisticated than a camera attached to a quadcopter. Modern inspection drones combine multiple sensor types, automated flight planning software, and post-processing pipelines that convert raw imagery into georeferenced, actionable data. Understanding how these systems work helps farmers evaluate inspection proposals, ask the right questions, and interpret what the final report actually means.
Radiometric Infrared Sensors and 1–2°C Detection Sensitivity
Not all thermal cameras are equal. Consumer-grade thermal cameras produce heat maps — color gradients that show relative temperature differences visually. Radiometric infrared sensors, the standard for professional solar inspection, record the actual measured temperature at every pixel in every frame. That distinction matters because it allows post-processing software to apply consistent temperature thresholds across an entire site and flag anomalies based on calibrated data, not visual interpretation.
Detection sensitivity at 1–2°C means the sensor reliably identifies a failing cell that’s running only slightly hotter than its neighbors — catching faults at their earliest stage, before they’ve caused secondary damage or measurable string-level output loss. By the time a fault is visible on a farm’s monitoring dashboard, it’s usually already well past the threshold a radiometric sensor would have flagged weeks or months earlier.
- Radiometric sensors record actual temperature values per pixel, enabling calibrated fault classification
- 1–2°C sensitivity catches early-stage cell degradation before monitoring dashboards register anomalies
- IEC 62446-3 compliance requires minimum irradiance of 600 W/m² during thermal capture for valid results
- Post-processing software applies temperature thresholds automatically across thousands of panel images
- Georeferenced output tags every anomaly with precise GPS coordinates and panel-level identifiers
The irradiance requirement is worth noting specifically for farm operators scheduling inspections. Flights conducted under cloud cover or in early morning conditions when panel output is low will not produce valid thermographic data under IEC 62446-3 standards. Professional inspection providers schedule flights within the solar window — typically mid-morning to early afternoon on clear days — to ensure the data holds up to the standard.
This is one of the clearest indicators of a quality inspection provider: if they’re willing to fly in suboptimal conditions to meet a schedule, the data they produce won’t be reliable enough to act on confidently.
RGB Video vs. Thermal Video: Which Sensor Catches What
Thermal sensors find electrical and thermal faults — hotspots, diode failures, cell cracks, string disconnections. RGB (standard visual) cameras find physical and surface-level issues — soiling patterns, panel damage, vegetation encroachment, structural problems with mounting hardware, and wiring conduit integrity. Neither sensor alone gives you a complete picture of array health. Dual-sensor payloads on platforms like the DJI Matrice 350 RTK and the Autel Evo II Dual capture both datasets simultaneously, which is why single-pass dual-sensor inspection has become the operational standard for professional solar farm surveys.
Automated Flight Paths and Georeferenced Data Output
Before a drone leaves the ground on a professional solar inspection, the flight path is already planned and uploaded. Mission planning software like DJI Terra or similar platforms maps the panel array boundary, calculates optimal altitude and overlap for the sensor package in use, and generates a fully automated grid flight that ensures consistent coverage across every panel row. Each image captured during the flight is tagged with GPS coordinates, altitude, heading, and timestamp — data that post-processing software uses to stitch thousands of individual frames into a single georeferenced thermal orthomosaic of the entire array. Every anomaly flagged in that mosaic carries a precise location that maps directly onto the farm’s panel layout, making fault-to-panel identification fast and unambiguous.
IEC 62446-3: The Inspection Standard Farmers Should Know
- Minimum irradiance: 600 W/m² at panel surface during thermal capture
- Wind speed limit: Below 4 m/s to prevent convective cooling that masks thermal signatures
- System output requirement: Array must be at or near rated output during inspection
- Temperature delta classification: Anomalies classified by ΔT above ambient — low, medium, and high severity
- Report documentation: Each anomaly must include location, thermal image, ΔT value, and recommended action
IEC 62446-3 is the international standard governing thermographic inspection of photovoltaic systems. For farmers, it matters for one practical reason: inspections conducted to this standard produce data that is defensible for warranty claims, insurance documentation, and financing compliance. An inspection report that doesn’t meet IEC 62446-3 conditions may not be accepted by a panel manufacturer when you’re trying to make a warranty claim on a failing module.
The wind speed limitation catches many farm operators off guard. A breezy day that feels perfectly flyable for a drone is often unsuitable for thermal inspection — ambient airflow across panel surfaces creates convective cooling that reduces the temperature differential between healthy and failing cells, making early-stage faults effectively invisible to the sensor. Professional inspection providers monitor real-time weather data and will reschedule rather than fly in conditions that compromise data quality.
The ΔT classification system built into the standard gives repair crews an immediate severity triage. A panel running 3°C above its neighbors is flagged differently from one running 20°C above — and the recommended actions differ accordingly, from monitoring and scheduling a ground check to immediate isolation and replacement.
When evaluating drone inspection providers, asking directly whether their workflow and reporting comply with IEC 62446-3 is a fast filter. Providers who don’t reference the standard, can’t explain its requirements, or offer to fly in conditions that would violate it are not operating at the level that produces reliable, actionable data for farm solar assets.
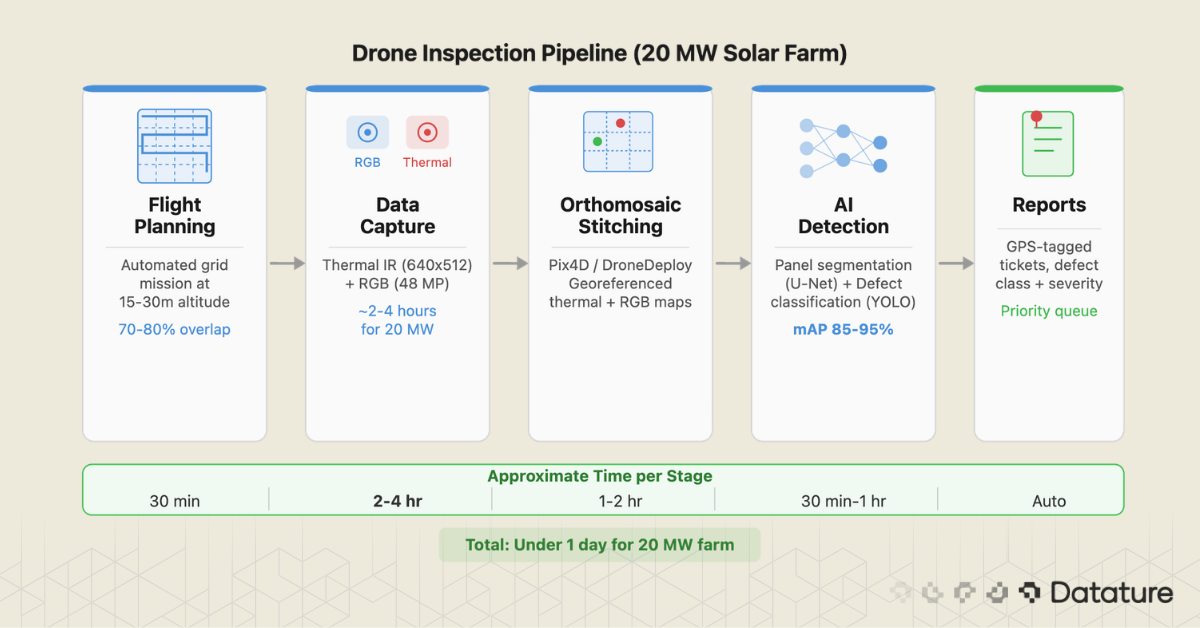
“Solar Panel Defect Detection with …” from datature.io and used with no modifications.
How Drone Data Connects to Farm Management Systems
Drone inspection data doesn’t live in isolation. The real operational value comes when georeferenced fault data integrates directly into the platforms farm managers already use to run maintenance, track asset health, and plan labor. That integration is what transforms an inspection report from a document you file into a workflow that drives action.
GIS Platforms, CMMS Tools, and Asset Management Integration
Modern drone inspection outputs are designed to feed into GIS platforms (Geographic Information Systems), CMMS tools (Computerized Maintenance Management Systems), and solar-specific asset management software. The georeferenced thermal orthomosaic produced by a drone inspection imports directly into GIS platforms where it overlays on the farm’s existing panel layout maps, making fault location identification immediate. Fault coordinates export as structured data — typically CSV or GeoJSON — that populates asset management systems with panel-level fault records without manual data entry. For farmers considering solar panel types, exploring the comparison between monocrystalline and thin-film solar panels could be beneficial.
For farms running large agrivoltaic systems with both crop and solar management needs, this integration means solar fault data sits alongside irrigation schedules, crop yield records, and equipment maintenance logs in a unified farm management view. A failed string on the south array becomes a work order in the same system tracking tractor service intervals — assigned, scheduled, and tracked to completion without leaving the platform.
How Repair Priorities Are Assigned From Drone Reports
Professional drone inspection reports don’t just list faults — they classify them. Using the ΔT thresholds from IEC 62446-3 and additional context from RGB imagery, faults are sorted into priority tiers: immediate action required, schedule within 30 days, and monitor at next inspection. That tiered output means a farm maintenance coordinator can hand the report directly to a ground crew with a prioritized repair sequence already built in — highest-severity faults addressed first, lower-priority items batched into scheduled maintenance windows to reduce truck rolls. For farmers looking to enhance their solar setups, understanding the benefits of PERC solar panels can be crucial.
30–40% Reduction in Maintenance Labor Hours After Integration
Farms that integrate drone inspection data into structured maintenance workflows consistently report significant reductions in the labor hours spent on solar array maintenance. When ground crews arrive on-site with precise fault coordinates, panel IDs, and severity classifications already in hand, they spend time fixing problems — not finding them.
- Targeted repair visits replace full-array walkdowns, cutting ground crew mobilization time
- Batched fault repairs reduce the number of separate site visits per maintenance cycle
- Pre-prioritized work orders eliminate on-site triage and decision delays
- Historical inspection data enables trend analysis, predicting where faults are most likely to recur
The 30–40% labor reduction is a direct result of replacing reactive, search-based maintenance with data-driven, targeted repair. Ground crews don’t walk rows looking for problems — they go directly to GPS-confirmed fault locations with the right parts already on the truck.
For farm operations where labor is a constrained resource — which describes most agricultural businesses — that efficiency gain compounds across every inspection cycle. Fewer labor hours per repair event means more maintenance events can be handled within existing crew capacity, without adding headcount or contracting additional service providers.
Best Drones for Solar Farm Inspection in 2025
Choosing the right drone for solar panel inspection comes down to three factors: sensor payload capability, flight endurance, and whether the platform supports automated mission planning. The drones below represent the current operational standard across utility-scale and farm-scale solar inspections — each with a distinct fit depending on array size, budget, and data requirements.
DJI Matrice 350 RTK With Dual-Sensor Payload
The DJI Matrice 350 RTK is the workhorse of professional solar farm inspection. With up to 55 minutes of flight time, IP55 weather resistance, and support for dual-sensor payloads combining the Zenmuse H20T thermal camera with a 20MP RGB zoom camera, it captures both thermal and visual data in a single automated pass. RTK positioning delivers centimeter-level GPS accuracy, meaning every fault flagged in the data set carries a precise location that maps directly onto panel-level site layouts.
For farm operations running 5 MW or more, the Matrice 350 RTK is the most capable single-platform option available. The dual-sensor setup eliminates the need for separate thermal and visual flights, and the RTK georeferencing ensures data integrates cleanly into GIS and asset management systems without manual coordinate correction.
DJI Mavic 3 Thermal for Smaller Farm Arrays
The DJI Mavic 3 Thermal brings radiometric thermal imaging and 48MP visual capture into a compact, portable platform that makes more economic sense for smaller agrivoltaic installations under 2 MW. It lacks the RTK positioning of the Matrice 350 and has shorter flight endurance at around 43 minutes, but for a farm operator who wants an in-house inspection capability without the enterprise-level cost, it delivers real radiometric data and automated flight support through DJI Fly and third-party mission planning tools. It is a practical entry point for farms that want to move away from annual third-party inspections toward quarterly self-managed surveys.
Autel Evo II Dual for Combined Thermal and Visual Capture
The Autel Evo II Dual 640T offers a competitive dual-sensor alternative to DJI’s lineup, pairing a 640×512 radiometric thermal sensor with a 48MP visual camera in a foldable platform with approximately 42 minutes of flight time. It operates on Autel’s independent software ecosystem, which matters for farm operations in regions where DJI products face procurement or regulatory restrictions. Thermal sensitivity is rated at less than 40mK, making it a capable fault detection platform for mid-size farm solar arrays where both hotspot detection and physical damage documentation are priorities.
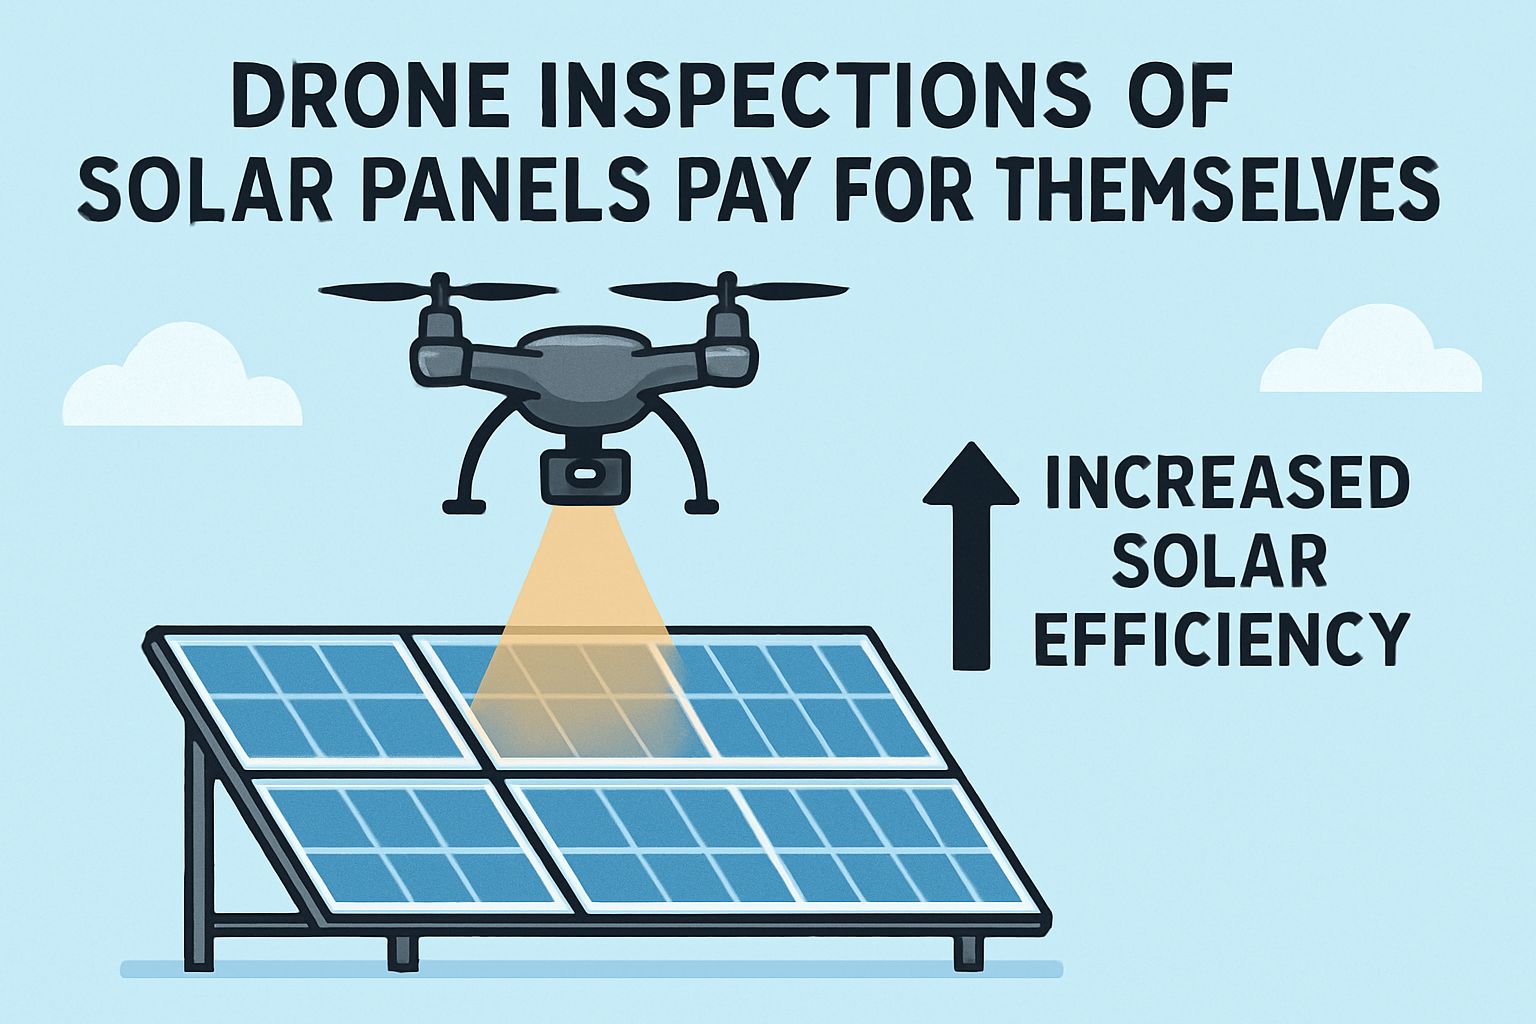
Drone Inspections Pay for Themselves — Here Is the Math
|
Site Size |
Inspection Cost Range |
5% Yield Loss Value |
Breakeven Fault Recovery |
|---|---|---|---|
|
1 MW |
$150 – $500 |
≈ $4,000/year |
Less than 2 weeks of losses |
|
5 MW |
$750 – $2,500 |
≈ $20,000/year |
Less than 7 weeks of losses |
|
10 MW |
$1,500 – $5,000 |
≈ $40,000/year |
Less than 8 weeks of losses |
|
20 MW |
$3,000 – $10,000 |
≈ $80,000/year |
Less than 7 weeks of losses |
The financial case for drone inspection is straightforward. Inspection costs are fixed, one-time, and predictable. Yield losses from undetected faults are cumulative, compounding, and invisible until a drone makes them visible. At $150–$500 per MW, a drone inspection on any farm solar installation larger than a few hundred kilowatts costs less than a single month of yield loss from faults that an inspection would have caught and flagged for repair. The ROI calculation isn’t complex — it’s just a matter of running it before assuming inspections are an overhead cost rather than a revenue protection measure.
Frequently Asked Questions
The questions below come directly from farm operators evaluating whether drone inspection fits their solar maintenance program. The answers are based on current inspection practice, regulatory frameworks, and real operational data from active farm solar inspection programs.
How Often Should Farmers Inspect Solar Panels With Drones?
For most farm solar installations, a minimum of once per year with a full thermal and RGB survey is the baseline. Higher-value systems, installations in dusty or high-soiling environments, or arrays that have experienced recent weather events — hail, high winds, flooding near panel bases — warrant biannual inspections. Farms with active agrivoltaic systems where vegetation management is ongoing benefit from quarterly RGB-only surveys between annual thermal inspections to track soiling and encroachment patterns without the full-inspection cost every cycle.
Do Farmers Need a Drone License to Inspect Their Own Solar Panels?
In the United States, flying a drone commercially — including for business-purpose inspections of your own farm infrastructure — requires an FAA Part 107 Remote Pilot Certificate. The certification exam covers airspace regulations, weather, flight operations, and drone performance. It is a written test, not a flight test, and most candidates pass after 10–20 hours of study. Hiring a certified drone inspection service eliminates this requirement for farm operators who prefer not to pursue certification themselves.
Can Drones Inspect Solar Panels in All Weather Conditions?
No — and this is one of the most important practical constraints to understand before scheduling an inspection. Valid thermographic data under IEC 62446-3 requires minimum irradiance of 600 W/m² at panel surface, wind speeds below 4 m/s, and the array operating at or near rated output. Cloud cover, early morning low-angle sun, and windy conditions all invalidate thermal results by reducing the temperature differential between healthy and degraded cells.
RGB visual inspections have more flexibility — overcast conditions are often acceptable for visual damage and soiling documentation — but thermal inspection, which is where the highest-value fault detection happens, is weather-dependent in ways that can’t be worked around without compromising data quality. Any inspection provider willing to fly outside these conditions to hold a schedule is producing data you cannot rely on for warranty claims, insurance documentation, or maintenance prioritization. For those interested in solar technology, understanding the best solar panels for farmers can be crucial for efficient energy use.
How Accurate Is Drone Thermal Imaging for Solar Panel Defects?
Modern AI-assisted drone inspection platforms process thermal imagery with up to 98.5% detection accuracy and false positive rates below 2%. That performance level applies when the inspection is conducted under IEC 62446-3-compliant conditions — correct irradiance, low wind, and calibrated radiometric sensors. Detection accuracy drops measurably when inspections are conducted outside these parameters, which is why condition compliance isn’t a formality — it’s the variable that determines whether the data is actually worth acting on.
For physical damage detection using RGB imagery, accuracy is closely tied to flight altitude and camera resolution. Inspections flown at 30–50 meters with a 20MP+ camera resolve detail fine enough to identify micro-cracks, frame deformation, and soiling patterns at cell level. Flights at higher altitudes reduce resolution and miss smaller-scale physical faults that would be caught at correct inspection altitude.
What Is the Difference Between Hiring a Drone Service and Buying Your Own Drone for Inspections?
Hiring a professional drone inspection service means paying $150–$500 per MW per inspection for a complete deliverable — flight operations, data processing, georeferenced fault report, and prioritized repair recommendations. You get certified pilots, calibrated radiometric sensors, IEC 62446-3 compliant workflow, and a report you can use for warranty claims and insurance documentation without any capital equipment investment or ongoing training commitment. For those interested in exploring different types of solar panels, here’s a comparison of bifacial vs. thin-film solar panels that might be beneficial for farmers.
Buying your own drone — typically a DJI Mavic 3 Thermal or Autel Evo II Dual for farm-scale operations — makes economic sense when you’re running inspections three or more times per year on an installation of 2 MW or larger, or when you have multiple farm sites that benefit from frequent monitoring between annual professional surveys. The upfront cost for a capable dual-sensor platform runs $3,000–$8,000, plus Part 107 certification time and ongoing training to interpret radiometric data reliably.
The practical middle ground many farm operators land on is an annual professional inspection for the full IEC 62446-3 compliant thermal survey — producing the documentation-grade report needed for warranties and insurance — combined with in-house quarterly visual checks using a lower-cost RGB drone to track soiling and visible damage between formal inspection cycles. That hybrid approach captures most of the protective value of frequent inspection without the cost of quarterly professional mobilizations on every site.
Drone inspections have revolutionized the way farmers maintain their solar panels. By using drones, farmers can quickly identify issues such as shading, dirt accumulation, or physical damage to the panels. This technology allows for a more efficient and cost-effective way to ensure that solar panels are operating at their maximum capacity. For those interested in understanding the differences between various types of solar panels, this comparison of monocrystalline and bifacial solar panels can be quite insightful.

Leave a Reply